
Annotated area charts with plotnine | Nicola Rennie
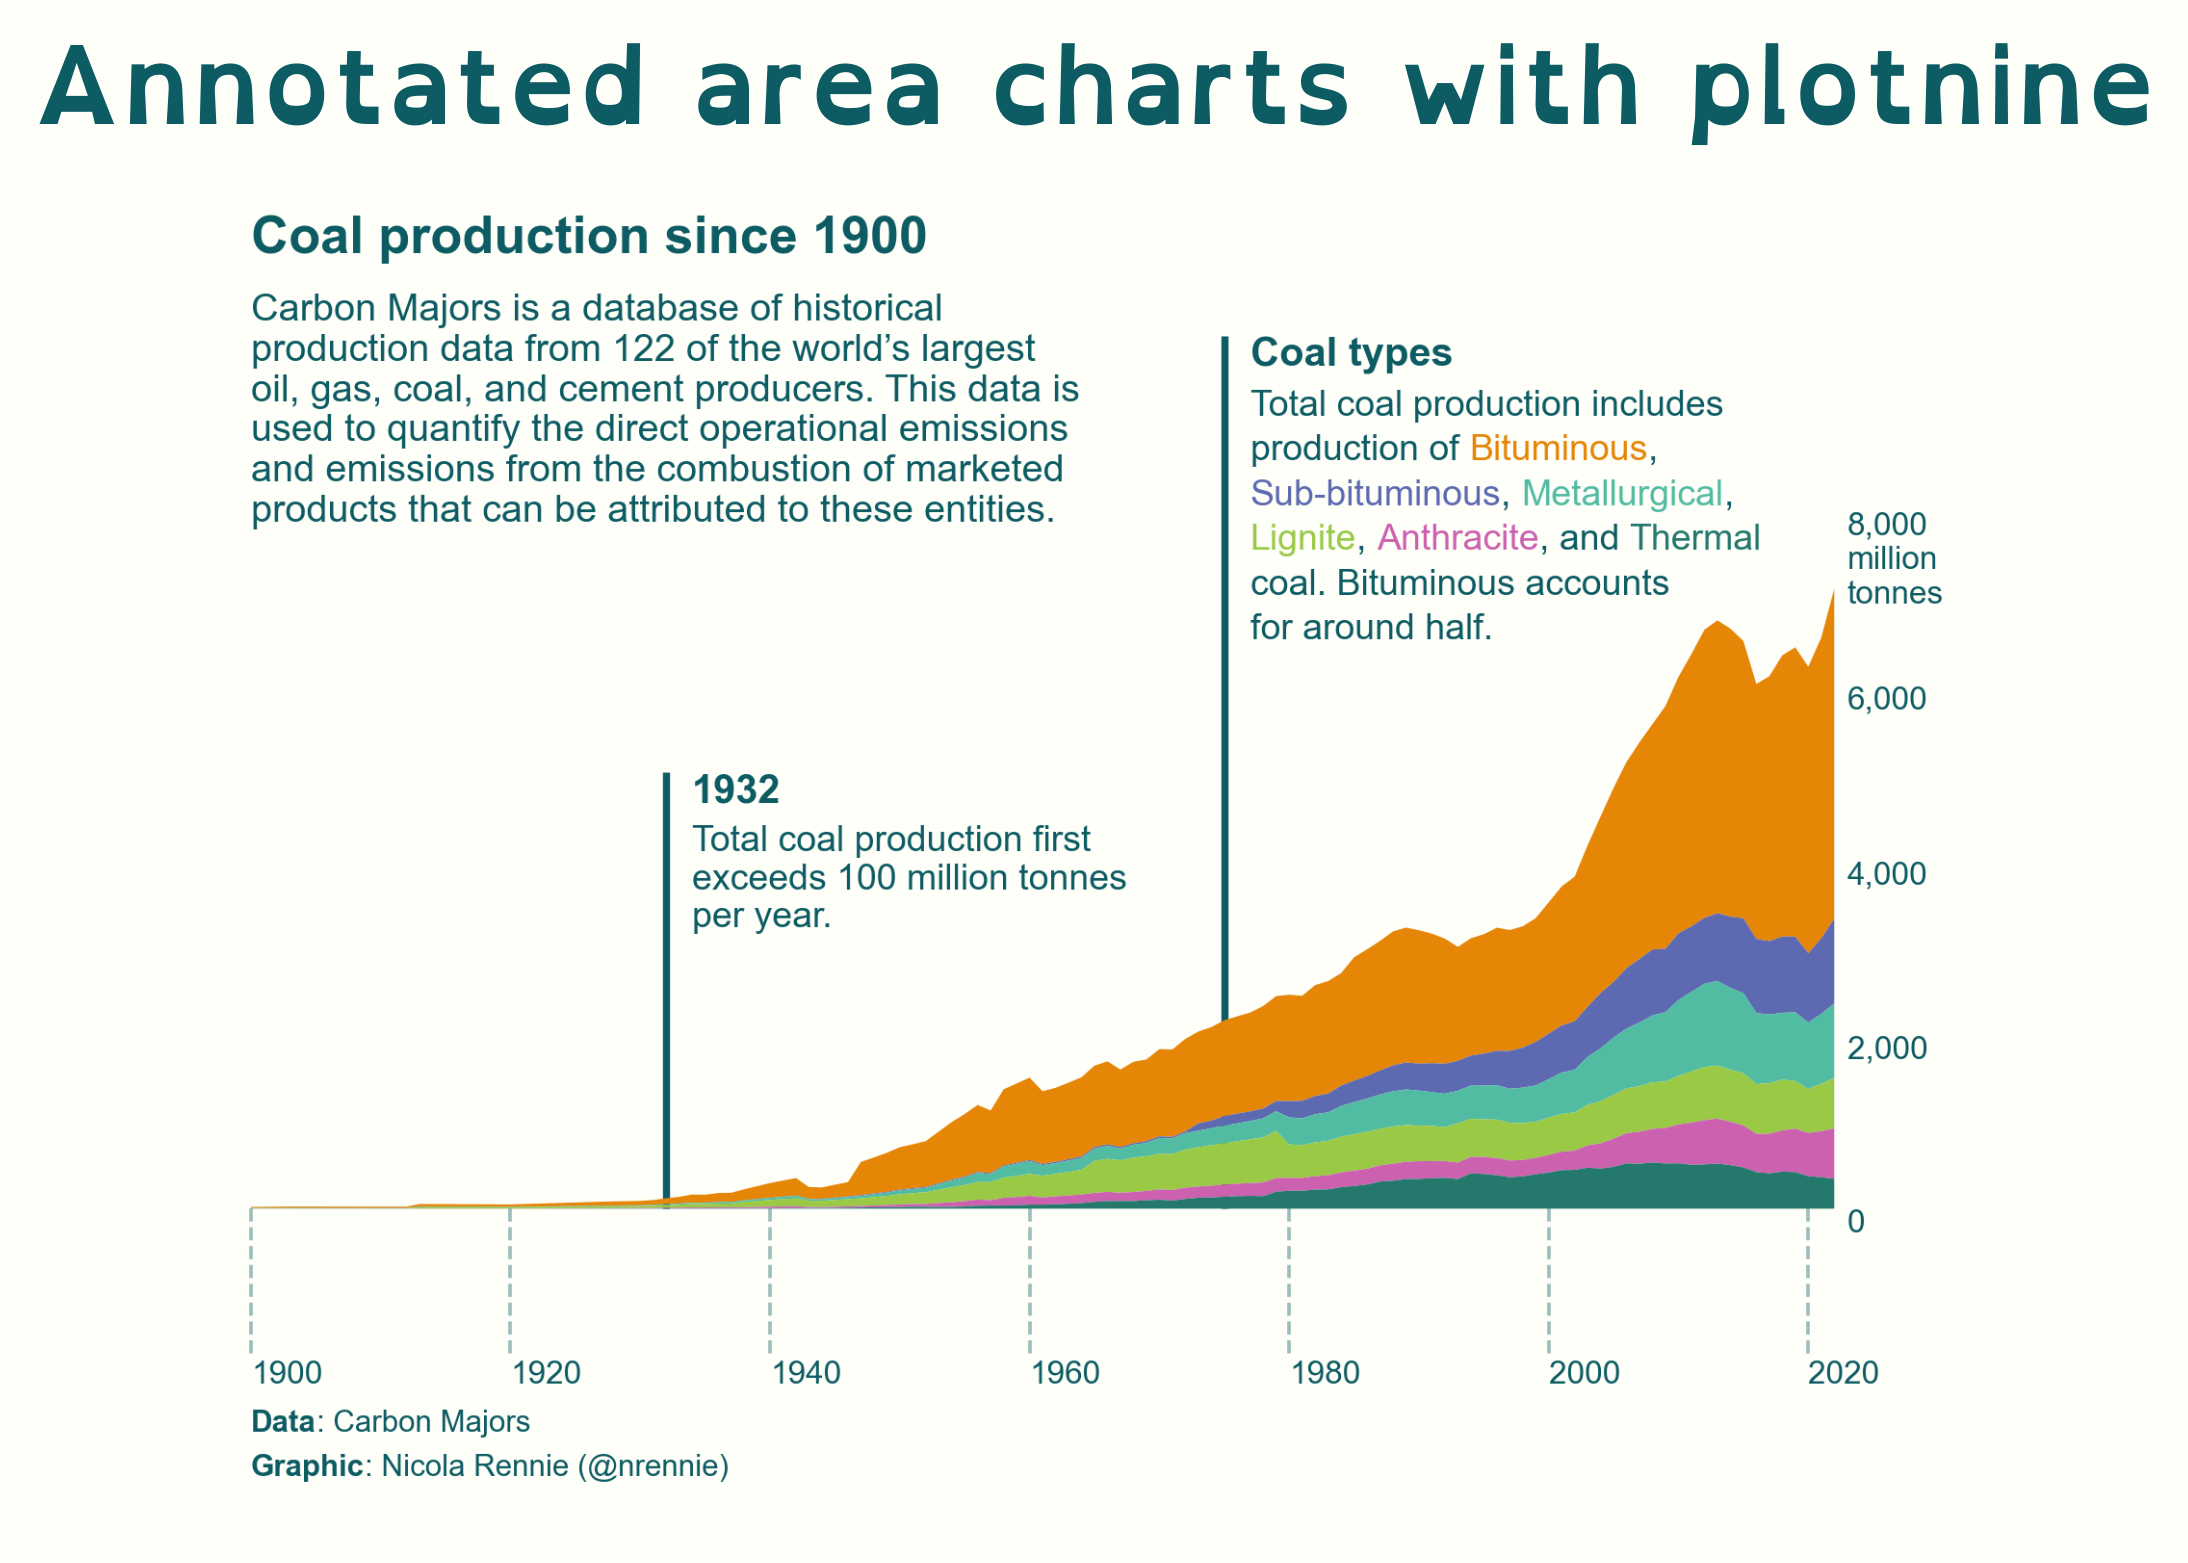
Link: Annotated area charts with plotnine | Nicola Rennie: "The plotnine visualisation library brings the Grammar of Graphics to Python. This blog post walks through the process of creating a customised, annotated area chart of coal production data."
Linked is an article about plotline, a python graphing package that I was not familiar with. Along the way the example shows how to take your raw data and extract from it the various series you will need building the graph. Excellent examples. But I wonder what gap this new package was filling among the multiple existing, popular and excellent graphing packages.